Saturday 5 November 2011

The final post

We had our exhibition on Tuesday night - what I found fascinating about the evening was the varied approaches the different disciplines took to portraying their water stories - there was a marked difference between planning, architecture and dance.  It got me thinking about how the community accesses information.  If the idea of our projects was to tell water stories, which may raise awareness of this finite and essential resource, then it's fantastic to be able to do it in different ways which gives people options of engaging in the way that they find most accessible and meaningful.

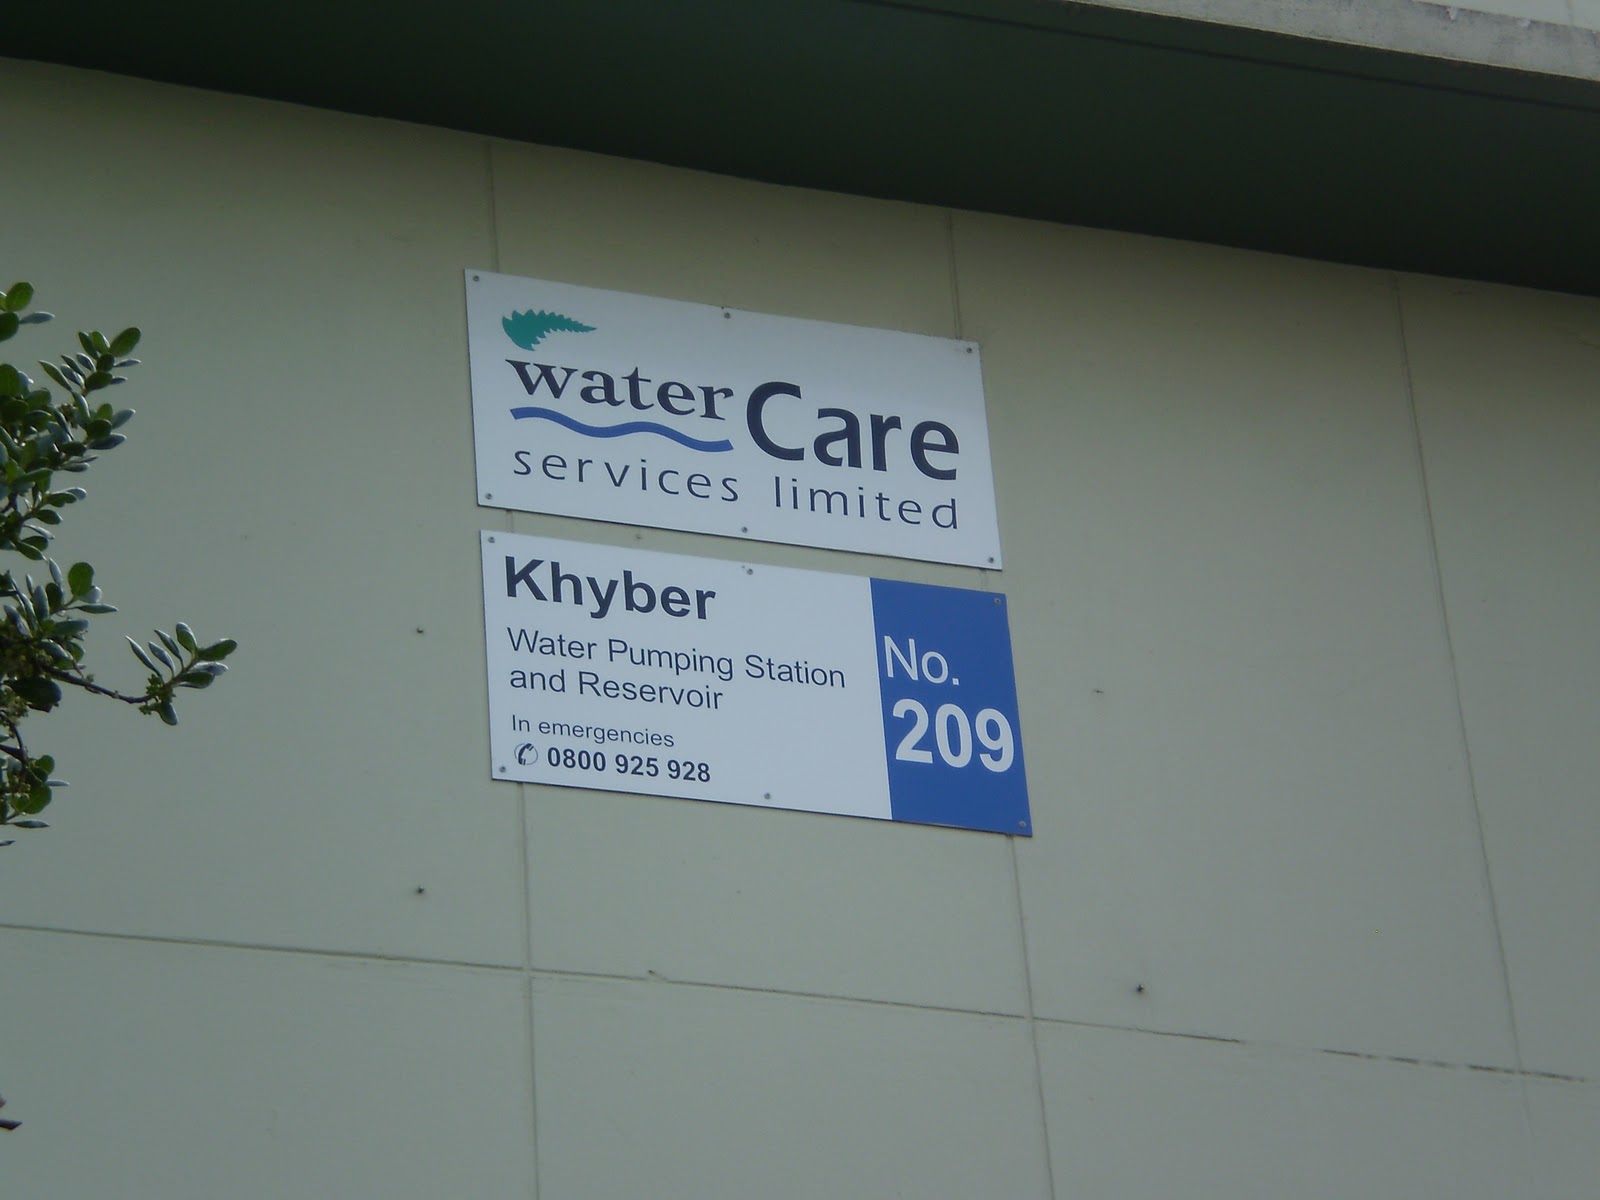
For me personally it’s been an interesting journey, all starting with a fascination with water reservoirs on Mt Eden.  While (unfortunately!) I discovered my drinking water system doesn't go via any volcanic cones, the project has given me an appreciation of the huge amount of infrastructure and systems needed for me to have fresh drinkable water in my home.  I also found it very useful using an existing map for inspiration (in this case the map of New York's Highline) in formulating my map, and also how to use notation to portray information in a new and imaginative way.

A highlight for me in this class was hearing Rata talk about the involvement of the community in Project Twin Streams.  Having so many different sectors of the community involved in different ways is wonderful and the potential positive spin-offs for the community immeasurable.

It’s that kind of micro-level engagement that I hope that Water in the Sustainable City, the wider project that this project is a tiny part of, will help in building people’s awareness of the intrinsic value of water.

Tuesday 1 November 2011

Finished project

This is my finished project, being displayed in our class exhibition tonight.

 
Sources of information:
Information about water infrastructure was sourced from Auckland Council’s GIS viewer: www.aucklandcouncil.govt.nz  and Watercare maps.
The base map came from Google: http://maps.google.co.nz.
The quote is from Invisible Cities by Italo Calvino.
All the photographs are my own.

Sunday 30 October 2011

Tracking the source

                    190 km                Flat Bush

         Totara Park                          a spot of minor trespassing (oops, sorry Watercare)

                Clevedon (that was a wrong turn)              Ardmore

         a prohibited defence area down an unsealed road (that was another wrong turn)

                    one waterfall                             two dope smokers   
        
       many rabbits                                  two Hunua dams          

                   and 5 hours later I've finally tracked my drinking water to its source.

It's certainly given me a new appreciation for when I turn the tap on.

Here are some photos from my trip:


On an aside, I loved these power boxes - during my water mapping journey I've wondered whether day-to-day infrastructure should be designed or displayed differently to make it more attractive or interesting - and here it's been done - gorgeous or an eyesore?  Gorgeous.


Now off to finish my map.

Friday 28 October 2011

Juxtaposition of fact and fiction

My map is almost finished.  I think the concept has come across quite well - using notation to represent the clinical facts of water infrastructure - distance, height, scale - differently, in a fictional and imaginative way.  

People looking at the map will see the water system but the main objective is for them to be able to engage in the map in a way they perhaps wouldn't if it was a typical engineering infrastructure map, with standard symbols (squares, triangles etc).   

Necessarily the map is a simplistic version of a very complex system.  This map was sent to me by Watercare.  It shows what my initial idea of a network based on the London Tube map might have looked like: portraying the system and connections without reference to correct scale.  
Source: Watercare.
Obviously this is very complex; my map will show just the main route between my house and water source, focusing on the length and notation of the water nodes to show the system.

Saturday 22 October 2011

The tip of an iceburg

My camera batteries ran out halfway through my network tracing trip today - in the middle of Penrose industrial area.  At least it didn't run out just when I got to the Hunuas!  That part of the trip is now postponed till later in the week.

Looking for water infrastructure in the fabric of the Penrose neighborhood was like looking for what is invisible in day to day life.  I became attuned to meter boxes, gas connections, electricity substations, a myriad of manhole covers, fire hydrants, broadband control boxes - a nexus of utilities.  Helpfully, water nodes seems to either have a Watercare label or are blue.  

The majority of water infrastructure is underground so my photos so far have been like showing the tip of an iceburg - some box, manhole cover or structure indicating a link to an underground maze.

And even going on half the route gave me an impression of how far water has to come every time I turn on my tap.  I'm looking forward to finishing the trip later in the week, particularly as I've never been to the Hunua Ranges.  

Friday 21 October 2011

Map analysis

Discussing my project at the last class session was useful – I’m now going to use the Highline map as the base for my project - see 15 September blog for map (the Tube map isn’t suitable as it lacks correct geographical scale – necessary to show the length of the water journey).

So looking closely at the Highline map, these are ways I'm thinking of adapting it for my project:

Path detail of the Highline – each section has basic illustration *** different pipe width – e.g. Hunua 1 & 3 watermain carrying most of the 57% of Auckland’s water supply that comes from the Hunua Ranges v the Pt Chev watermain supplying part of that water to Pt Chevalier.

Street names / buildings which enable people to locate and access the Highline *** not practical to have street level of detail - instead I can use suburbs which show the city-scale of my map.

Labels e.g. such as stairs for accessing the walkway *** label infrastructure with a specific function e.g. AWMA070 Bulk Supply Point or No. 15 Control Valve.

Renderings are used to show sections of the pathway – different scales but most show people which of course is the point of the walkway – for people to enjoy *** my photographs will be at different scales as well – ranging from taps, to water meters to treatment plants – making the invisible visible. 

Other features:
Different sized text - can’t make out why except it adds to the aesthetic.

Background of map is outline of streets and plots – Highline coloured to make it visible. 

Have a couple of ideas of things I want to do differently – one is to show the role gravity plays in the system by labeling each infrastructure node’s height above sea level.

Collecting images


Earlier this week I took photographs of infrastructure near my house – interesting seeing spaces I see all the time in a very different context.  
Tomorrow I’m going to venture further afield – all the way to the source – the Hunuas.

Tuesday 11 October 2011

Pulling the project together

I’ve driven, bussed or walked past the corner of Symonds St and Mt Eden Rd dozens of times but never noticed the reservoir which fills half of that block.  Talk about invisible.  That’s exactly what my project is: mapping that type of “invisible” infrastructure which brings water from the Hunua Ranges to my house.

Thinking about presentation - I’m keen to base my map on the London Underground map discussed in "Mapping Experience" by M Treib in Design Quarterly – the maps are similar in that they both portray invisible essential infrastructure and have disregard of real world spatial reference (p 11).  The purpose is not to portray correct geographic scale but instead to help a traveller find their way from one station to another (London tube map) or tracing the flow of water from node to node back to its source (my map).
The ideas I’m trying to pull together for the presentation are –
  • How can I use different weighting and colouring of lines to show different flow volumes?
  • How can I portray the nodes? 
  • Shall I incorporate gradient to reflect gravity in the system?
  • What form of graphic can I use to show the dynamic flow of water?

  • How shall I integrate photographs of infrastructure in a meaningful way?  For example these photographs of Khyber Pass Reservoir:


 Source: Author's own.

Thursday 6 October 2011

Highlighting the invisible

Anything can be portrayed in a map.  The mix of maps at the opening of the You Are Here: Mapping Auckland exhibition at Auckland Museum yesterday was interesting: blueprints for new suburbs, animated traffic maps and social and health statistics of the region, amongst many other charts and records. 
The dynamic map where visitors are invited to add their stories was gorgeous – typing my story and reading others’ stories made me feel like I was a part of Auckland and a part of a wider story.  The snippets of stories portrayed what is hard in a map – the complexity, depth and colour of life – like is described in Calvino’s Invisible Cities (see the quote in a previous blog).
In terms of the presentation of my project, I liked how some maps had sections reproduced at greater scale on a separate block next to the main map.  I was thinking of doing something similar with the photographs of infrastructure that are a key part of my project: highlighting the invisible.
For me personally there is such an interest in seeing the invisible: my favourite map at the exhibition was a 19th century representation of Auckland’s volcanic field by German geologist Ferdinand von Hochstetter.  This is a section of the map showing One Tree Hill and the associated lava flow.  Auckland is built on lava fields but this isn’t visible, except near some cones or where the lava has flowed into the harbour.  It is so interesting to see on the map where the lava flows under the houses and roads that are the city as I know it.  The porous lava also helps move water through the city - at the Onehunga Aquifer and from Mt Eden through to Western Springs.
  Source: Auckland Museum
                                                    Available: http://www.aucklandmuseum.com/?t=1645#explore-map
I need to develop my presentation ideas further.  Creative representation is not a strength of mine so I’m planning on using next week’s class to ask for feedback and ideas on what I have for my project so far.

Thursday 29 September 2011

Project Twin Streams

Our class went on a thought-provoking fieldtrip to Project Twin Streams in Henderson yesterday. 
The part that grabbed my attention was the enormity of the project - and that impression was from seeing only a very small part of the total project.  In particular, it was fascinating seeing how the project operates at a micro level requiring intensive community engagement.
Source: Katrina David
The streams have gone from a negative space for the community - regularly being flooded and used as a rubbish dump (a cleanup of a small section of the stream the weekend before our visit yielded seven tyres and one shopping trolley, amongst other things), to a space where individuals and groups can interact positively with the stream and its surrounds.
Our seminar is all about communicating places and telling stories linked to water.  Walking the path along the stream’s edge was like seeing a snapshot of the local community.  Different groups care for different sections of the stream, reflecting their priorities and interests by what they have done with their section. 

A class from a local school is responsible for a garden filled with plants used for traditional Maori medicinal purposes.  Another garden has been planted with flaxes by the weaving circle from the nearby Corbans Estate, a community art center.  The members care for the garden and harvest the flax for their use. 
Source: Katrina David
An outdoor education class scientifically monitors the quality of the stream water.  There is a sportsfield that runs alongside part of the stream, where members of a sports team were training during our visit.  Even local people part of a Corrections PD programme are a regular part of the maintenance of the stream.  These plaques are from people who have contributed to the project in some way. 
Source: Katrina David
I asked our tour guide Rata, the Community Co-coordinator of the project, where the community will comes for such an intensive project.  She said the will is there – in church groups, passionate teachers at local schools, other groups in the community etc – it just needs to be tapped into and facilitated.    
Some benefits of the community’s engagement with the stream are obvious, but total benefits must be immeasurable.  Linking it to our seminar, the project overall has created the opportunity for a wide spectrum of the community to create a positive relationship with, take ownership of and take pride in, this local water body.  They have the opportunity to spend time there (in the sportsfield, or commuting along the pathway), growing plants for use, enhancing the quality of the stream itself, protecting the space and being part of a project with the rest of the community.

Project update...
I now have the maps I need to trace the source of water that comes to my house - maps from Watercare showing the water network and distribution zones for from water sources throughout Auckland, and the interactive GIS viewer on Auckland Council's website.  The next step in my research will be to make connections between these maps and then go out and do some field research.

Thursday 22 September 2011

370 million litres

Every day 1.46 million Aucklanders use 370 million litres of treated water, travelling through 9,000 km of pipes.  In the process 40,000 cubic metres of water is lost - per day.

I haven't been able to obtain the maps I need for my proposed project so I am thinking about alternatives.  Mapping these and other figures in a scale and context that people can relate to is one option. 

The idea of mapping scale in an understandable context comes from the interactive BBC Dimensions website.  Using this website people can manipulate statistics from current or historical events into a context that they can relate to. 

For example, this map shows the scale of the 2010 Gulf of Mexico oil spill, and how the area it would have covered when laid over Auckland:


The objective of this project would be the same as my original project - raising awareness of the existence of freshwater and its value as a resource in our city and people's lives. 

Tuesday 20 September 2011

Draft Auckland Plan and water's place-making role in Auckland

Today the Auckland Council released the draft Auckland Plan – the 30 year overarching strategic vision for Auckland.  Chapter 10 addresses physical and social infrastructure, which includes water. 
The following excerpts from the draft Plan demonstrate (a) the critical importance of water to the city; (b) the economic cost to Auckland of current infrastructure and issues for future supply; (c) the role of water in the place shaping of Auckland.

Critical importance of water infrastructure
The draft plan emphasises the critical importance of water infrastructure:
“Auckland’s water is as intrinsic to the region as the land, and bears a deep cultural significance to Māori with the concept of mauri key to the management of Auckland’s water assets. The sustainable provision of water services is of the highest importance to the Council and the requirement to provide for critical water infrastructure is recognised as a core priority for the Auckland Plan.”
(Page 149 - emphasis added)
and lists indicative examples of existing critical water infrastructure:
• Sources, including dams and extraction facilities
• Freshwater main pipelines
• Ardmore treatment plant
• Huia treatment plant
(Page 147)
Cost of water infrastructure
This second excerpt shows the significance of the location of water sources and the impact of water having to travel over a long distance to reach its destination (as will be demonstrated in my mapping project). 

The need for additional capacity is met with increasing cost associated with water provision.  The proximate, economical sources for Auckland water have now been exploited, leaving only more distant and expensive options for increasing network supply. In addition, approximately 40,000 cubic metres per day of potable water is lost in conveyance to consumers at a cost of almost $50 per property per year. That amount of leakage brings forward the time when Auckland must invest in a new water source, which will add a substantial cost to water users”
(Page 149)

Not only is there is a high economic cost to water travelling long distances to reach its destination but there is also an environmental cost.  Water is a finite resource and every day that is 40,000 cubic metres of a critical non-renewable resource being lost.  As infrastructure ages, this loss and associated costs will increase.  And as Auckland Council is solely in charge of water supply for Auckland (unlike other large infrastructure such as transport which is shared between central and local government) that means the Council is responsible for these costs.

Water in place-shaping
The draft Plan also states that infrastructure has wider benefits than just delivering necessary functions throughout the city.  Infrastructure has a place-shaping role, and plays a part in creating stronger and more resilient communities: “Infrastructure is a… powerful tool to shape growth within the urban system” (page 145). 
This is illustrated in the diagram: water (potable) is in the bottom layer, giving it a region-wide place shaping role.  Other place-shaping infrastructure becomes more people specific and localised towards the top of the triangle.

Source: Auckland Council

Draft Auckland Plan
My mapping project will illustrate the points the draft Plan raises: remote sources of water, complex and vast networks of pipes and other infrastructure.  My project will also demonstrate the place-shaping role of water infrastructure by portraying this fundamental service in a way that makes the everyday role of water services tangible and accessible.

Thursday 15 September 2011

Methodology


So here's my kitchen tap.  My mapping is going to trace the route that water takes to reach my kitchen.  I'm expecting to encounter pumping stations, reservoirs, a treatment plant and finally following the raw water to its source - most likely a dam in the Hunuas, but possibly the Waitakeres, the Waikato River or groundwater - or perhaps a mixture.  That's the question.
I'm also keen to learn about the elevation of the different nodes, and the role gravity plays in the system - flowing from high in the Waitakeres, to a volcanic cone in the city, to my house - perhaps?


Source: Author's own.

My research will focus on the systems (part of the 900km of pipes and various infrastructure) around and through the city.  So first research stop will be Watercare, Auckland Council council-controlled organisation in charge of water and its infrastructure in Auckland in the hope they can give me a detailed plan of freshwater systems in the city-western suburbs.  Then hopefully I will be able to trace back from there.
Presentation - I'm thinking two maps - one Auckland-wide water infrastructure systems map based on the London Underground map.  The second is the specific tracing water from my house to its source. 

I like this map of the Highline in New York (referred to in an earlier blog), particularly the photographic inserts which connect the points with place and add context and depth to the map.  Water infrastructure in the city tends to be invisible or not prominent - photographs of reservoirs or a pumping station will increase awareness of the necessity of this infrastructure.
 Firstly however will be my research - starting with Watercare.


Source: http://www.thehighline.org/

Thursday 18 August 2011

Where does my drinking water come from and how does it get to my tap?

My research is going to be guided by this question - finding the source of Auckland's drinking water and mapping how it reaches my home.

The London Tube map seems a possible base map - the aim is to portray a system, with little regard to geographic correctness and no scale requirement.  The underground infrastructure and nodes of water infrastructure (reservoirs, pipes and treatment plants) seem similar to the underground railway lines and stations of the Tube.


London Tube Diagram by Paul E. Garbutt
Source:http://www.20thcenturylondon.org.uk

The methodology will involve gathering data and information from primarily Auckland Council and its CCO Watercare, although this will need to be developed further.

Re mapping the invisible - this is a beautiful quote from Invisible Cities:
A map of Esmeralda should include, marked in different coloured inks, all these routes, solid and liquid, evident and hidden.  It is more difficult to fix on the map the routes of the swallows, who cut the air over the roofs, dropping long invisible parabolas with their still wings, darting to gulp a mosquito, spiraling upward, grazing a pinnacle, dominating from every point of their airy paths all the points of the city.
(Calvino, I.  (1972)  Invisible Cities.  Harcourt: Orlando Florida.)

Friday 12 August 2011

In the news

A couple of relevant recent articles from the NZ Herald -

A report by the Hauraki Gulf Forum (established by the Hauraki Gulf Marine Park Act 2000 to promote the sustainable management of the Hauraki Gulf) into the current state of the Gulf.  The report records increasing levels of nitrogen (from rural runoff) and pollution: http://www.nzherald.co.nz/nz/news/article.cfm?c_id=1&objectid=10744343.

An exhibition and auction of photographs of nature by celebrities with the aim of bringing environmental issues into the public conscious and encouraging positive environmental action (the idea being similar to our mapping project - a different forum for portrayal of the environment):
http://www.nzherald.co.nz/nz/news/article.cfm?c_id=1&objectid=10744526.

Thursday 11 August 2011

Plotting volcanic water

This stunning map from 1866 shows the influence of volcanoes on the geomorphology of the Auckland region: http://www.teara.govt.nz/en/auckland-places/19/2
Seeing that map and learning about Auckland's geomorphology has given me a new understanding of volcanoes and their role in natural and man-made water activities in the Auckland region:
  • Waterfalls over volcanic lava in the Waitakere Ranges
  • Orakei and Panmure Basins - volcanic craters connected to the ocean
  • Lake Pupuke - a fresh water lake
  • One Tree Hill - the porous basalt lava creates an acquifer with 27300 cubic metres of water flowing through it every day (is used as the water supply for the surrounding area - http://www.arc.govt.nz/environment/volcanoes-of-auckland/water-resources.cfm)
  • Meola Creek - created by lava flows from Mt Eden
  • Western Springs - natural springs dammed to become a lake
  • Mt Eden & many other cones containing reservoirs either within or on the slopes
Altogether 48 volcanoes are within 20km of Auckland's centre, almost all of which have been modified by people (including several cones destroyed for the construction of Auckland Airport and Mangere sewage treatment plant).
Yesterday our class heard a talk from an environmentalist and a biologist.  The impact on Auckland's waterways by humans is massive.  A brief list from the lecture includes:
  • drained wetlands
  • removal of vegetation
  • dammed rivers for stormwater outlets
  • piped rivers
  • urbanisation creating impervious surfaces leading to runoff and species being flushed out to sea
  • extracted water for drinking
  • extracted sediment
  • introduced pest species - fish, weeds, trees (which now dominate)
Combining all these factors: the extent of volcanic influence on the geological formation of Auckland, the importance of the cones in contemporary life, how humans have permanently changed the formation of the cones and their impact on waterways - it's vital that this unique environment is protected from any further damage and, where possible, restored.
Next step: develop my project further, and connect and map these water features.

Sunday 7 August 2011

How to create societal change: regulation/taxation, education or frightening and scary statistics?

Enough water to fill 150,000 Olympic sized swimming pools is pumped to Auckland residents EVERY DAY.  An even more mind-boggling statistic is while one person requires 2-4 litres of drinking water per day, it takes 2,000-5,000 litres of water to produce one person's daily food.  (For more scary statistics, see the United Nations-Water website (link below)).  With only 2.5% of the Earth's water being fresh, to me it makes water seem like a precious finite resource that needs to be treated with great care.

I'm not the only one: last Thursday I attended Late at the Museum, an event held at Auckland Museum in conjunction with the University of Auckland and the Aqua exhibition to raise awareness of water issues.  What struck me was the reaction by the audience during a panel discussion on the issue of water quality in Auckland.  Halfway through the discussion by the panellists an audience member spontaneously asked a question, opening up a flood of questions which were eventually cut off when time had run out.  The audience was obviously informed, frustrated and angry that (they perceived) little was being done to address the pollution of rivers and the effects of the urban environment on our water and its ecosystems.

So some people care and want to do something about water issues.  Others don't.  How to create societal change and get on board these people who don't care?  That seems to me the aim of our assignment.  NZ is perceived as a water rich country (as a classmate stated in my Sustainable Development class last week) - so why bother changing?

To create a paradigm shift in society's view however is very complex and probably a mixture of regulation, tax (I suspect people would consume a lot less if they were charged upfront the true cost of the capture of water in dams, transmission through many hundreds of kms of pipes, and treatment), education (although with the huge amounts of information flowing through our daily lives, would it stick?) and scary statistics and images.


My project is still being formed but I'm interested in the invisible infrastructure of water, particularly it's origins: in Auckland dams in the Hunua Ranges supply 57% of our water supply, 26% is from dams in the Waitakere Ranges, 10% from the Waikato, Mahurangi and Hoteo Rivers and the balance from groundwater supplies at various places around Auckland (including One Tree Hill).  How to map aquifers???

Perhaps if people had a simple way to understand the complexity of our water systems and the cost of receiving the water, they would not take it for granted.  Then those people who don't care may join those who do.  It doesn't matter for what reasons people change their attitudes, it's just essential that they do.

Thanks to:
Watercare (Auckland's water provider) for the Auckland statistics and photographs: www.watercare.co.nz.
UN-Water for the global statistics: www.unwater.org/statistics.html.
Auckland Museum http://www.aucklandmuseum.com/?t=1139.

Sunday 31 July 2011

Issues in placemaking

To understand place requires engaging people, historical events and stories, rather than a technical portrayal of space.  It is complex and colourful. 
Mythologies of Placemaking, an article by B. D. Wortham-Galvin from Place: Forum of Design for the Public Real outlines dangers in placemaking: recreating mythical places of the past, in a contemporary context, with accompanying values and ideals; and/or by prescriptive re-creation which does not allow for change, discussion, adaption (e.g. New Urbanism).  W-G also discusses the power of media in the portrayal of romantic/unrealistic ideals of place (e.g. New England in idealised television programmes). 
I agree with this danger: placemaking in an idealised way would result in disassociation and dissatisfaction with reality and impossible ideals.  There is also the additional danger of experience and perception of place (e.g. through television programmes) playing a powerful role in creating people’s ideas, leading to compounded dissatisfaction and disassociation.  Instead it needs engagement, informed discussion and shared histories.
To segue to our assignment - I am interested in the place of the volcanic cones and water in the life of Auckland (part of the water supply chain - Mt Eden, Mt Wgtn etc; volcanic lava aquifer - One Tree Hill; recreational lakes - Lake Pupuke).  Wondering how these can be mapped in a way which engages people and contributes to their sense of place.
And thanks to Dancing Cities - CQD for the blog's background image: http://www.cqd.info/eng/index.php

Thursday 28 July 2011

New York's High Line

I love the High Line in New York - a fabulously imaginative and creative idea of how to restore an old and unused part of the city to become a destination for visitors and residents, be of ecological benefit, revitalise parts of the city, amongst many other benefits.  I wonder how water can be brought more into Aucklanders' minds and lives? 

Notation...

Thinking about how to represent Auckland's water in one of its many forms - challenging for a planner who likes conventional maps and everything to fit in boxes and make sense.  Interesting reading on notation - and how notation can be used to represent the intangible.  Cities and communities are so complex and dynamic - fascinating to think of different possible representations.